What Crawl Analytics shows you
Crawl Analytics is a log of real bot requests to your domain over the last 30 days. It's not derived from your sitemap or your codebase — it's the actual traffic Encited has served to crawlers, broken down by path and provider.
The page has three layers, top to bottom:
- Metric cards — high-level summary
- Crawler distribution chart — who's visiting most
- Crawl Stats / activity list — per-path bot activity, with SEO issues attached
The metric cards
| Card | What it counts |
|---|---|
| Top Search Crawler | The search-engine bot (Googlebot, Bingbot, Yandex, etc.) that hit your site the most over 30 days. |
| Top AI Crawler | The AI bot (GPTBot, ClaudeBot, PerplexityBot, etc.) that hit your site the most. Getting visited by AI bots means your content is eligible to appear in AI answers. |
| Total Crawls Served | Total bot requests served across all paths, all providers. |
| Est. Crawl Budget Saved | An estimate of repeat crawls earned because your pages responded fast and cleanly. The faster and more reliable your pages are, the more often crawlers come back. |
If you see "—" or "Not enough data", DNS isn't fully connected yet, or bots haven't found your site in the last 30 days. New domains usually start populating within 24–72 hours.
The activity list (Crawl Stats tab)
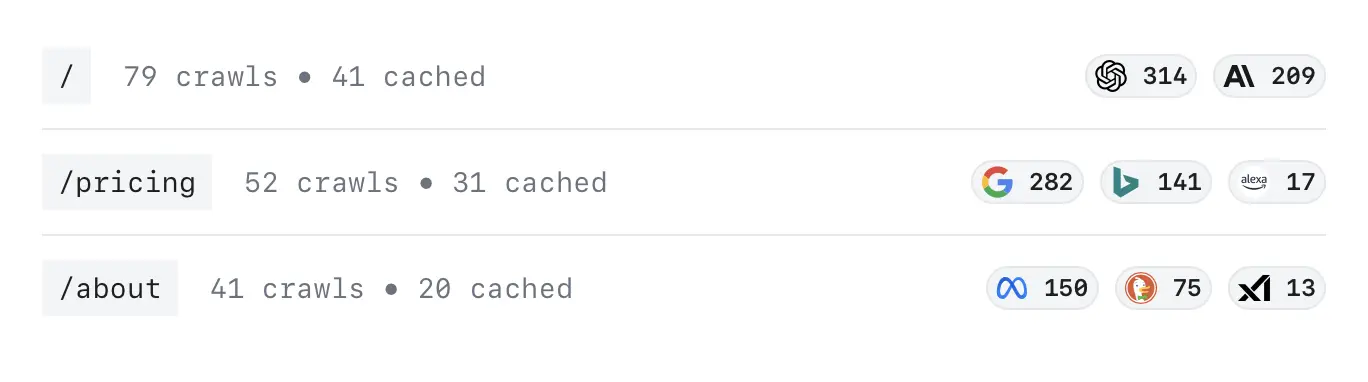
Each row is one path on your domain that received at least one bot request in the last 30 days. Rows are sorted by request volume — busiest paths at the top.
A row shows:
- The path — e.g.
/,/pricing,/blog/why-prerender. Click it to open snapshot details. - Issue badge — number of SEO issues found on the latest snapshot of this page (e.g. "3 issues"). Color codes severity: red = errors, amber = warnings. Click to see which issues, copy a fix prompt for your AI builder, or trigger a re-render.
- Provider chips — small icons showing which crawlers hit this path and how many times each.
- Checkbox (left, hover) — select multiple paths to bulk re-render.
What "X requests" means
It's the count of crawler requests served, not unique pages. One bot hitting /pricing ten times in a week shows as 10 requests on that row.
Why some pages show issues and others don't
Issues come from the last cached snapshot of that page. If Encited has never rendered that path (because no crawler has fetched it yet, or you just connected), it has no snapshot — and therefore no issues to report. Issues populate as snapshots get created.
Snapshot details
Click any path to open its snapshot detail page. This is the rendered HTML Encited serves to bots, parsed and broken down for you.
You'll see:
- Status badge + last-refreshed time — when this snapshot was last rendered. Click Re-render in the top right to refresh it on demand.
- Crawl Activity — recent bot hits for this specific path, with timestamps and user agents.
- SEO Issues — every issue detected on this snapshot, grouped by severity, with a "Copy prompt" button that builds an AI-builder prompt to fix them.
- Title & Meta Tags — what bots see for
<title>,<meta description>, robots directives, canonical URL. - Open Graph / Twitter — preview of social share cards including the OG image (with size and aspect-ratio checks).
- Headings — every
h1–h6on the page in order, so you can spot missing or duplicate headings at a glance. - Body text + word count — what content is actually in the rendered HTML (not just what's in your source). This is what AI engines and search bots ingest.
- Raw HTML — the full pre-rendered document, exactly as a crawler receives it.
If the snapshot fails to load, the page itself probably hasn't been rendered yet. Click Re-render to queue it.
Things that look wrong but are normal
"I have 200 URLs in my sitemap but only 30 in Crawl Analytics"
This is expected. Crawl Analytics shows paths that crawlers have actually requested — not your sitemap. The other 170 URLs simply haven't received a bot request in the last 30 days yet. Possible reasons:
- They're newer than the last crawler sweep.
- They're deeper in your site structure and crawlers haven't gotten to them.
- They're not linked from any high-traffic page.
- The sitemap was added recently and hasn't been re-discovered yet.
It does not mean those pages aren't pre-rendered — they are, the moment a bot asks for them (or you click Re-render all). Crawl Analytics is a record of demand, not coverage.
To proactively pre-warm everything in your sitemap, click Re-render all at the top of the Crawl Stats tab. That renders every URL in your sitemap whether bots have asked for it or not.
"I see paths that aren't on my site (e.g. /wp-admin, /.env, /phpmyadmin)"
Also normal. Crawl Analytics records any URL a crawler requested more than once — including port scanners, vulnerability scanners, and bots probing for common admin/CMS paths that don't exist on your domain.
These are safe to ignore. Encited and Cloudflare block them at the edge, so they never hit your origin and they don't consume your render quota. The dashboard surfaces them so you have full visibility, not because you need to act on them.
The dashboard shows a small note about this when you have more than 10 paths.
"Crawl Analytics has been empty for days after I connected DNS"
Two things to check:
- Has DNS actually verified? Go to your dashboard — the domain status should be
connected, notpending. If it's still pending, finish the DNS setup first. - Have you submitted the site anywhere? Bots discover your domain through links, sitemaps, and search-console submissions. A brand-new domain with no inbound links may take a week before any crawler shows up. Submit your domain and sitemap in Google Search Console to speed things up.
"Numbers fluctuate day to day"
The dashboard is a rolling 30-day window. As days drop off the back of the window, totals can decrease even if traffic is steady.
Acting on what you see
The activity list is most useful as a triage tool. A typical workflow:
Sort by volume — busiest paths first
The list is already sorted that way. Crawler interest is a strong signal of which pages search engines and AI engines consider important on your site.
Look for amber/red issue badges on those high-volume paths
A page that gets crawled a lot AND has SEO issues is your biggest-impact fix. Click the badge to see exactly what's wrong.
Click 'Copy prompt' and paste into your AI builder
The prompt asks the AI to verify each issue against your live page, separate real issues from false positives, and propose code fixes — without making changes until you approve.
Publish your fix, then re-render the affected page
Either click Re-render on the issue popover, or open the snapshot detail page and click Re-render there. New snapshot is ready in seconds.
Check back in 24–72 hours
Crawlers typically re-visit improved pages within a few days. Watch the issue badge clear and the request count climb.
Bulk fixes: Select multiple paths with the checkboxes and click Re-render selected to refresh many snapshots at once after a sitewide change.
Crawler Distribution chart
Switch from the Crawl Stats tab to the Crawler Distribution tab to see total requests per provider as a horizontal bar chart. Useful for answering questions like:
- Is Googlebot or Bingbot the bigger driver of crawl traffic on my site?
- Are AI crawlers (GPTBot, ClaudeBot, PerplexityBot) starting to show up?
- Are there providers I didn't know existed?
Each bar shows the provider's logo, name, and total request count over the 30-day window.
Sharing the dashboard
The share button in the top right of the activity section creates a public link to a read-only version of this dashboard for your domain. Useful for sharing crawl visibility with clients, leadership, or non-logged-in collaborators without giving them dashboard access. The shared view hides the action buttons (re-render, settings) but shows all metrics and the activity list.
Related guides
- Set up via DNS — get pre-rendering active so Crawl Analytics has data to show
- SEO Spider — proactively crawl your own site to surface issues before bots do
- Cache refresh rules — when snapshots auto-refresh
- On-demand render — programmatically refresh snapshots after publishing